Data Dazzle: Mastering The Art Of Infographics Without A Boring Chart In Sight
Data Dazzle: Mastering The Art Of Infographics Without A Boring Chart In Sight

The power of infographics cannot be overstated. These visual representations of information can captivate your audience and create memorable content that resonates with them. Understanding what makes an infographic effective and how to create one is essential for any brand or marketer looking to elevate their content strategy.
The Power of Infographics
Infographics are a powerful tool for conveying complex information visually appealingly. They can simplify data and statistics, making it easier for audiences to understand and retain the presented information. Infographics can grab attention and communicate critical messages using compelling visuals and engaging design elements.
Infographics are also highly shareable on social media platforms, making them a valuable tool for increasing brand visibility and driving traffic to websites. With the rise of information overload, infographics provide a refreshing and engaging way to consume content, making them a must-have in any marketing strategy. In today's fast-paced digital world, conveying information quickly and effectively is more critical than ever. Infographics are the perfect solution for capturing attention and delivering key messages.
Captivating Your Audience
One of the key benefits of using infographic examples is their ability to captivate your audience. In today's fast-paced world, people are constantly bombarded with information, making it challenging for brands to stand out. Infographics offer a visually appealing way to capture attention and convey important information in a format that is easy to digest and share.
Infographics are also a great way to simplify complex data and statistics. Instead of overwhelming your audience with a wall of text or a barrage of numbers, you can use infographics to present more visually appealing and understandable information. This can make your content more engaging and memorable, leading to better retention and comprehension among your audience. Plus, let's be honest - who doesn't love a good infographic? They're like the colorful, snack-sized version of boring old data.
Creating Memorable Visual Content
Creating memorable visual content is essential for any brand looking to make an impact in the crowded digital landscape. Infographics provide an opportunity to tell a story through visuals, making it easier for audiences to connect with the message. By incorporating compelling graphics and engaging design elements, brands can quickly master how to make an infographic and leave a lasting impression on their audience.
Infographics are also highly shareable, making them a valuable tool for increasing brand visibility and reaching new audiences. People who come across visually appealing and informative content are likelier to share it with their networks, amplifying the brand's reach and impact. This makes infographics a powerful asset for any brand looking to stand out in the digital noise and create a memorable impression on potential customers.
Understanding Infographics
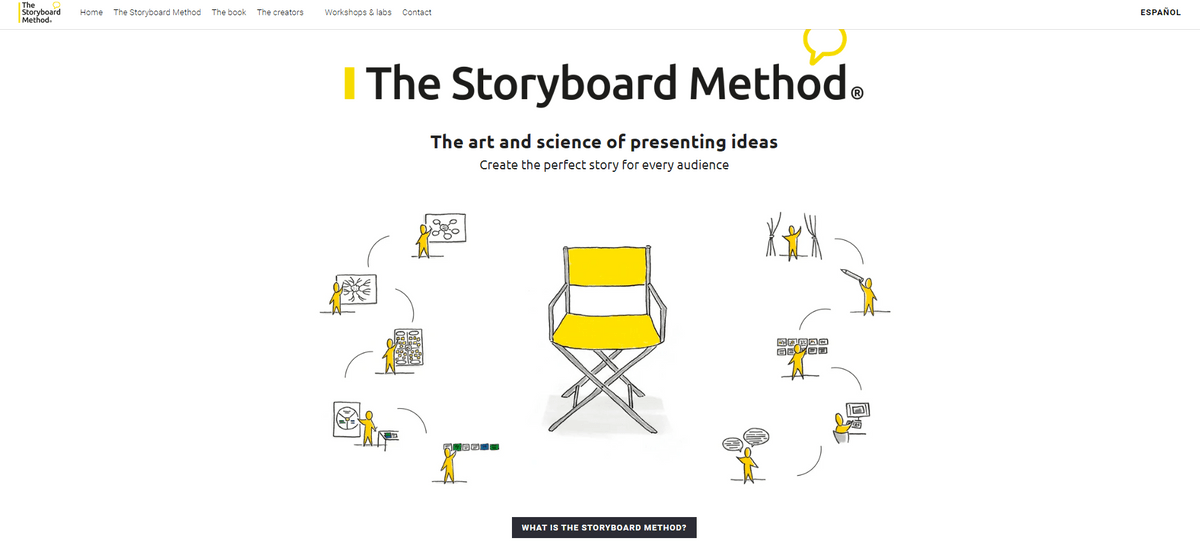
Image taken from The Storyboard Method
Infographics are powerful visual tools that effectively communicate complex information clearly and engagingly. By combining data, visuals, and storytelling, infographics can simplify complex concepts and make them more accessible to a broader audience. Understanding what is an infographic makes it easier to capture attention and memorably delivering information.
What Makes Infographics Effective
The effectiveness of infographics lies in their ability to present information in a visually appealing format that is easy to understand. Infographics can quickly grab the viewer's attention and effectively communicate critical messages using compelling infographic examples, bold colors, and concise text. This makes them an ideal choice for presenting data-driven content in an informative and visually stimulating way.
Infographics are also easily shareable across social media platforms, making them valuable for increasing brand visibility and engagement. In today's fast-paced digital world, infographics provide a quick and engaging way to convey complex information and stand out in a sea of text-based content. Whether you're looking to educate your audience, showcase your expertise, or add visual flair to your content, infographics are worth considering as part of your marketing strategy.
Why Infographics Stand Out
In today's digital age, where content overload is the norm, infographic examples stand out as they offer a refreshing change from traditional text-heavy content. Their visual appeal draws viewers in and encourages them to engage with the content on a deeper level. With their ability to condense complex information into easily digestible visuals, infographics have become an essential tool for brands looking to make an impact with their content.
In addition, infographics are highly shareable on social media platforms, making them a valuable asset for brands looking to increase their online visibility. With the potential to go viral, infographics can help companies reach a wider audience and drive more traffic to their website. By incorporating infographics into their content strategy, businesses can effectively communicate their message and stand out in a crowded digital landscape.
The Benefits of Using Infographic Examples
The benefits of using infographic examples are numerous. They help improve comprehension and retention of information and increase engagement on social media platforms by making it easy for users to share visually appealing content. Additionally, infographics can enhance brand awareness and authority by positioning brands as thought leaders in their respective industries.
Infographics are also a great way to simplify complex information and make it more accessible to a broader audience. Using visuals and minimal text, infographics can break down intricate concepts into easily digestible chunks, making them ideal for explaining complex topics or processes simply and engagingly. In a world where attention spans are shrinking, infographics provide a quick and visually appealing way to convey critical information without overwhelming the audience.
Stay tuned for the next section on Elements of Compelling Infographics, where we will delve into the critical design elements that make an infographic stand out!
Elements of Compelling Infographics
Image taken from Blackcube
1. Clarity and Simplicity
In the realm of compelling infographics, clarity, and simplicity reign supreme. These visual masterpieces distill intricate data into bite-sized, easily digestible portions. How do they achieve this feat? Through a harmonious blend of concise text, crystal-clear visuals, and an impeccably structured flow of information. The text is wielded with precision—succinct yet potent enough to convey the core message effortlessly. Complementing this, the visuals act as beacons, guiding the audience through the data maze. They're not just ornamental; they serve a purpose, elucidating complex concepts with charts, graphs, and images that speak volumes at a glance. And in this symphony of information, a logical sequence is the conductor. Each section seamlessly connects to the next, ensuring a smooth journey for the reader and making even the most intricate data feel like a stroll through a well-organized garden of knowledge.
2. Visual Appeal
The allure of compelling infographics lies in their captivating visual appeal. They wield an arsenal of engaging visuals that serve as the backbone of their impact. Icons dance across the canvas, distilling concepts into instantly recognizable symbols. Illustrations breathe life into ideas, transforming complexity into relatable imagery. Charts and graphs step forward, translating raw data into elegant visual narratives, while images punctuate key points with vividness and relevance. Each optical element isn't just decorative; it's an integral part of the storytelling. They don't just adorn; they enlighten. Their strategic placement and symbiotic relationship with the content elevate the entire narrative, ensuring that every glance and gaze is rewarded with deeper comprehension and a lasting impression.
3. Storytelling Narrative
Within the realm of compelling infographics, the power of storytelling narrative reigns supreme. These visual tales don't just present data; they weave a captivating journey for the audience. With a narrative flow akin to a well-crafted story, they beckon the reader to embark on an information adventure. Guiding them through a meticulously structured and logical sequence, these infographics unfold like chapters in a book. They begin with an enticing hook, enticing the audience to delve deeper. Each section extends seamlessly, building upon the last, crafting an engaging storyline. Every visual element and snippet of text contributes to this narrative arc, ensuring that the audience remains captivated, informed, and eager to journey further through the story being told within the infographic's carefully curated landscape of knowledge.
4. Data Accuracy and Credibility
The cornerstone of compelling infographics lies in the bedrock of data accuracy and unwavering credibility. These visual marvels thrive on the integrity of their information. Precision in sourcing and presenting data isn't just a choice; it's a mandate. Each statistic, fact, or figure is meticulously verified, ensuring its authenticity and reliability. Citing credible sources acts as a beacon of trust, reassuring the audience of the infographic's legitimacy. By meticulously adhering to these principles, infographics convey information and establish trust with their readers, fostering confidence in the presented data. This commitment to accuracy serves as the linchpin, elevating the infographic from mere visuals to a dependable and respected source of information.
5. Color and Design Harmony
Color and design harmony wield a formidable influence within compelling infographics. They are the artists' palette and brushstrokes, orchestrating a symphony of visual delight. A well-chosen color palette, meticulously curated, invokes emotions, conveys meaning, and guides the viewer's eye through the narrative. Each hue serves a purpose, harmonizing with precision to evoke the intended response. Consistency in design elements, from fonts to shapes and layout, isn't just about aesthetics; it's the backbone of clarity and coherence. It ensures a seamless flow of information, allowing the audience to navigate effortlessly through the infographic's landscape. Like a well-choreographed dance, these elements work in unison, transforming the visual experience into a harmonious journey that captivates, informs, and leaves an indelible impression on the mind.
Crafting Your Own Infographics
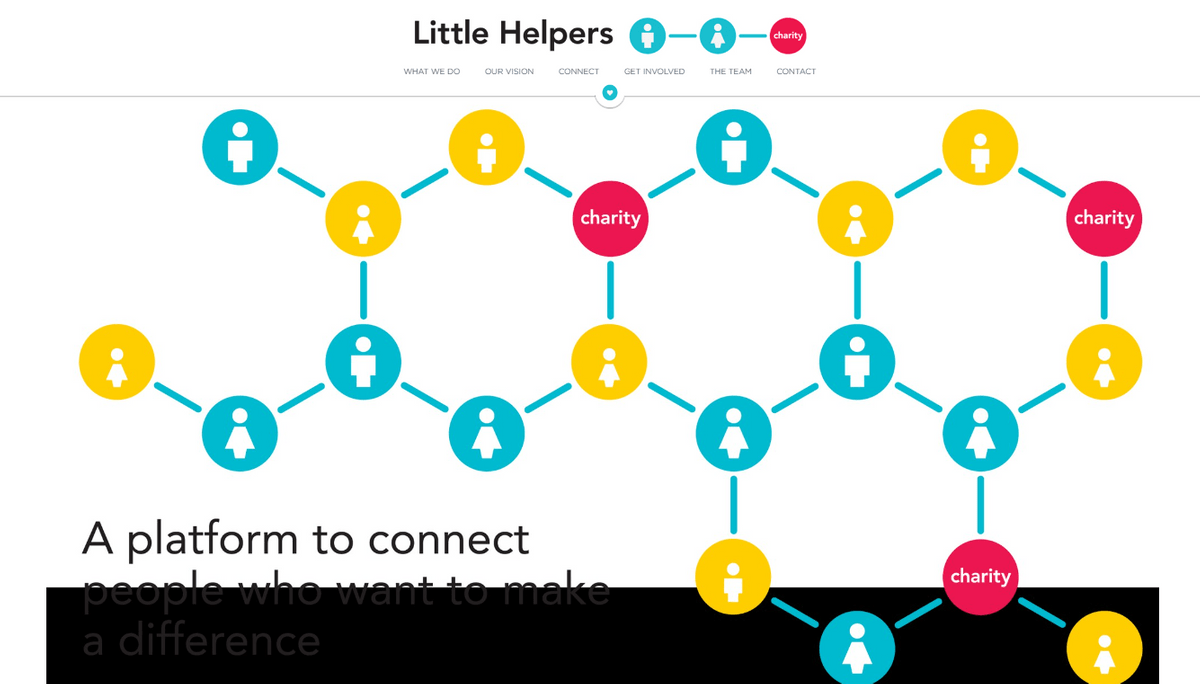
Image taken from Little Helpers
Infographics are a powerful tool for visual storytelling, and creating your own can be a game-changer for your brand. Several user-friendly tools, such as Canva, Piktochart, and Venngage, are available for creating infographics. These platforms offer a wide range of templates, graphics, and fonts to help you bring your ideas to life and create stunning visuals that captivate your audience.
Tools for Creating Infographics
Canva is one of the best tools for creating infographics due to its user-friendly interface and extensive library of design elements. With Canva, you can easily drag and drop elements onto your canvas, customize colors and fonts, and add data visualizations with just a few clicks. Piktochart is another popular option that offers customizable templates and easy-to-use design tools, making it perfect for beginners. Venngage is known for its various infographic templates catering to different industries and purposes.
If you're looking for a more advanced tool, Adobe Illustrator is a favorite among professional designers for its robust features and endless customization options. While it may have a steeper learning curve, the results are well worth the effort. For those on a budget, Visme offers a free version with plenty of design assets and templates to get you started on creating stunning infographics without breaking the bank. Whether you're a beginner or a seasoned designer, plenty of options can help you bring your data to life in visually appealing ways.
Step-by-Step Guide to Infographic Design
1. Define Your Objective
At the genesis of crafting compelling infographics lies the pivotal step of defining your objective. This foundational cornerstone sets the compass for the entire creative voyage. It's the beacon guiding the narrative, the North Star illuminating the path ahead. To embark on this journey, clarity in purpose is essential. Define the raison d'être of the infographic—identify the core message, data, or insights you aim to impart. Is it to inform, persuade, educate, or entertain? Understanding this purpose shapes the entire creation process, dictating the choice of visuals, the tone of language, and the information structure. By crystallizing your objective, you anchor your creative endeavors and ensure that your infographic resonates powerfully with its intended audience, delivering a clear and impactful message.
2. Gather Data
The quest for compelling infographics embarks with an essential step: gathering data. Like an archeologist unearthing treasures, this process involves delving into knowledge repositories and seeking accurate and relevant information. The bedrock of a robust infographic relies on the solidity of its data. It's about more than quantity but the quality and credibility of sources. Scouring through reputable archives, conducting thorough research, and verifying data integrity becomes the bedrock upon which the infographic narrative thrives. Each datum unearthed is a building block, fortifying the structure of the story to be told. With a meticulous approach to data collection, the resultant infographic gains authority, trustworthiness, and the potential to resonate profoundly with its audience, leaving an enduring impact.
3. Choose a Layout
Selecting the layout marks a pivotal juncture in creating compelling infographics—a decision that molds the visual landscape of information. It's akin to choosing the blueprint for an architectural masterpiece, a layout that breathes life into the data. Whether it's a timeline, a comparison chart, a flowchart, or any other format, the choice isn't merely aesthetic; it's strategic. Each layout offers a unique canvas to showcase the story, guiding the audience through the data in a structured and coherent manner. This decision isn't about fitting content into a predefined template; it's about tailoring the format to convey the narrative best, ensuring that every visual element and text snippet finds its perfect place. With the proper layout as the framework, the infographic transforms into an engaging visual narrative, seamlessly leading the audience through a journey of information.
4. Visualize Information
Visualizing information stands as a cornerstone in the art of crafting compelling infographics. It's transmuting raw data into captivating visuals—a symphony of icons, charts, graphs, and images that breathe life into information. These visuals aren't mere adornments; they're the storytellers, translating complex data into easily digestible, visually appealing elements. Icons and illustrations simplify concepts, while charts and graphs transform numbers into vivid narratives. Each visual component isn't just a depiction; it's a strategic choice to elucidate, clarify, and enrich the narrative. When wielded adeptly, these visuals become the catalysts that elevate an infographic from mere data to an immersive visual experience, engaging the audience and etching the information into their memory.
5. Craft Engaging Copy
Crafting engaging copy is a pivotal step in the orchestration of compelling infographics. It's the art of weaving words into a tapestry that complements and enhances the visual elements, guiding the audience through the labyrinth of information. Each word is a brushstroke, concise yet vivid, painting a narrative that aligns seamlessly with the visuals. Clarity reigns supreme; the text isn't an embellishment but a strategic ally, delivering key insights and augmenting the impact of the visuals. Every phrase is meticulously chosen to strike a balance between brevity and depth, ensuring that the audience is not only informed but also captivated. When the copy and visuals converge harmoniously, they create a synergy that transforms an infographic into a compelling story, resonating deeply with the audience and leaving a lasting impression.
Tips for Effective Storytelling through Infographics
1. Define Your Narrative
The foundational step of defining your narrative lies at the heart of creating the best infographics. It's the compass that directs the entire creative process. Start by identifying a clear and captivating storyline—a narrative thread that weaves through the data, guiding the audience on an illuminating journey. Pinpoint the core message or insight you wish to convey, ensuring it aligns with the audience's interests and needs. This narrative acts as a roadmap, ushering readers through a structured and logical sequence of information. By crafting a compelling storyline, infographics transform from data presentations into captivating visual tales, ensuring that each element serves a purpose in guiding the audience toward a meaningful and impactful conclusion.
2. Visualize the Story
Visualizing the story within an infographic examples is like painting a vivid picture that resonates with the audience. The essence of this art lies in using visuals as strategic tools to bolster the narrative. Charts and graphs, those pillars of clarity, streamline complex data into easily digestible insights. Meanwhile, illustrations and icons inject life and context, transforming abstract concepts into relatable images. The magic happens when each visual element seamlessly aligns with the narrative flow, acting not as mere decorations but as integral parts of the storytelling process. When wielded skillfully, these visuals elevate the infographic, transforming it from a collection of data points into a captivating visual journey that captivates, educates, and leaves an indelible impression on the viewer.
3. Craft Engaging Copy
Crafting engaging copy is the linchpin of exceptional infographics—an art that melds seamlessly with visuals to create a harmonious narrative. It's about distilling complex information into concise, impactful text, perfectly matching visuals. The key here is conciseness; every word counts. The copy should enhance the narrative without overshadowing the visual elements. By maintaining a focused approach, it highlights key points, amplifies the storyline, and guides the audience through the information maze effortlessly. When written with precision, this concise copy doesn't just complement the visuals; it amplifies their impact, transforming an infographic from a data display into a captivating visual story that engages, educates, and resonates with its audience.
4. Balance Design Elements
Achieving the pinnacle of infographics hinges upon the delicate balance of design elements—a symphony where every note harmonizes perfectly. Harmony in design is paramount to crafting the best infographics. This entails meticulously selecting a cohesive color palette that evokes emotions and reinforces the narrative. Consistency in fonts, shapes, and layouts is equally crucial; they form the backbone of a coherent visual language. Each element plays a role, contributing to the overall aesthetic and readability. When these design components align seamlessly, they transform the infographic into a visually captivating masterpiece. It's not just about aesthetics; it's about creating an immersive visual experience that effortlessly guides the audience through the story, leaving a lasting impression in their minds.
5. Data Accuracy and Credibility
At the core of crafting the finest infographics lies the bedrock of data accuracy and unwavering credibility. Ensuring the precision of the data woven into an infographic is paramount. Each statistic, fact, or figure must be rigorously vetted and substantiated by credible sources. Citing these sources isn't just a formality; it's the cornerstone of building trust and credibility with the audience. By upholding these principles of accuracy and credibility, an infographic transforms from a mere information collection into a reliable, authoritative source. This commitment validates the content presented and establishes a strong bond of trust between the creator and the audience, forging the path for an infographic that resonates deeply and leaves an enduring impact.
6. Choose the Right Format
Selecting the correct format stands as a pivotal step in the craft of creating outstanding infographic examples. It's the choice that shapes the canvas upon which your narrative unfolds. Whether it's timelines, comparisons, flowcharts, or other formats, each layout isn't merely a visual choice; it's a strategic decision. The chosen format acts as the scaffolding that supports your storyline, ensuring a seamless alignment between content and presentation. It's about more than just fitting data into a template; it's about tailoring the format to convey your narrative best. By selecting a format that resonates with your story, infographics transcend the realms of data presentation, becoming compelling visual tales that captivate, inform, and resonate deeply with the audience.
7. Focus on Flow
The artistry of creating top-tier infographics is intricately tied to the flow—the orchestrated journey through information. A seamless and logical progression becomes the guiding force in captivating the audience. It begins with a hook, a compelling entry point that beckons attention. Then, the main content unfurls systematically, each section building upon the last, crafting a cohesive narrative. It's not just about presenting data; it's about crafting a story. And like any great tale, it culminates in a robust and resonant conclusion—a takeaway that lingers or a call to action that inspires. By meticulously structuring infographics with this focused flow, they transcend from mere presentations into immersive experiences, guiding the audience on a captivating and enlightening journey from start to finish.
8. Test and Refine
Testing and refining infographic examples form the final act in their creation, ensuring their potency and impact. It's the polishing stage where every facet undergoes scrutiny. Reviewing for clarity, coherence, and visual appeal becomes paramount. Is the message crystal clear? Does the narrative flow seamlessly? Are the visuals engaging and aligned with the content? These questions guide the refinement process, fine-tuning every element to perfection. Testing the infographic on a sample audience becomes the litmus test, gauging its effectiveness and resonance. Feedback gleaned from this process isn't just valuable; it's transformative. By iterating and refining based on insights gathered, infographics evolve from good to exceptional, becoming powerful tools that engage, inform, and leave an indelible mark on their audience.
Kickstart Your Website With Us!
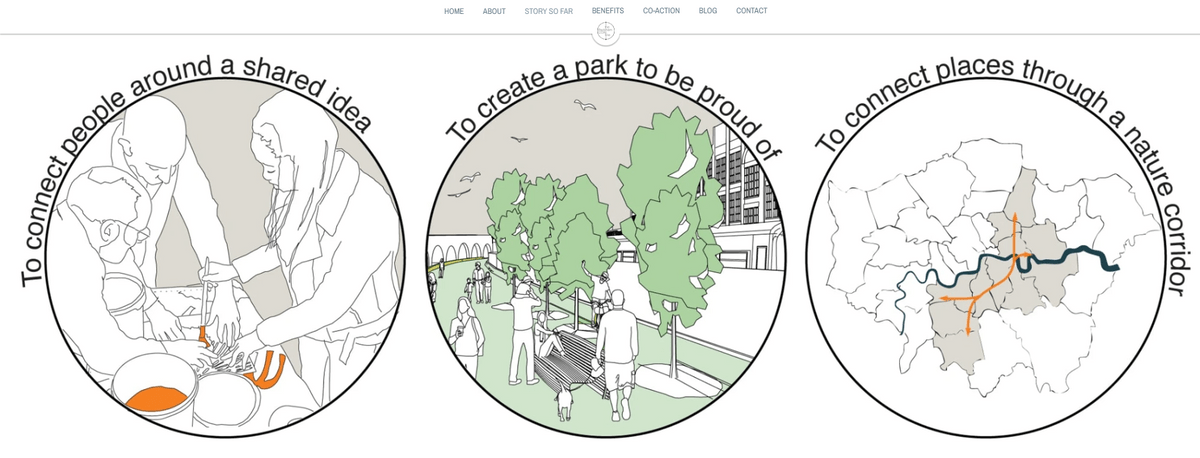
Image taken from Peckham Coal Line
Infographics are a game-changer when it comes to elevating your content strategy. Incorporating visually appealing and informative graphics lets you capture your audience's attention and convey complex information engagingly. With the ever-increasing demand for visual content, infographics are an invaluable tool for boosting your brand's online presence and driving traffic to your website.
Elevating Your Content Strategy with Infographics
Utilizing infographics as part of your content strategy can significantly enhance the overall appeal of your brand's messaging. By presenting data and statistics in a visually compelling format, you can effectively communicate key insights to your audience while maintaining their interest. Using striking visuals combined with concise text ensures that your message is understood and remembered long after it's been seen.
Inspiring Your Audience Through Visual Storytelling
Infographics have the power to inspire and captivate audiences through the art of visual storytelling. Creating narratives with impactful images and data-driven content can evoke emotions, spark curiosity, and leave a lasting impression on your audience. This approach allows you to connect with viewers deeper, fostering more robust engagement and loyalty towards your brand.
Empowering Your Brand with Infographic Examples
When empowering your brand, infographics are crucial in establishing authority and credibility within your industry. By showcasing well-researched data in an easily digestible format, you position yourself as an expert in the eyes of your audience. Furthermore, by consistently producing high-quality infographics that provide value to viewers, you solidify your brand's reputation as a reliable source of information.
By understanding what makes an infographic effective, analyzing the best infographic examples from top website builders like Strikingly, and learning how to make an infographic using the right tools and design principles, you can create memorable visual content that resonates with your audience while empowering your brand's online presence through compelling storytelling.
Want to discover more about building a powerful online presence? Chat with us today!


