Website Performance Reporting That Leads to Better Decisions
Website Performance Reporting That Leads to Better Decisions

A website report should explain what changed, why it matters, and what happens next. Website performance reporting becomes useful when marketing, sales, content, and website owners can read the same evidence from shared definitions.
That requires a connected view. Tracking traffic quality over time shows whether the site is attracting useful attention. Measuring leads generated by pages identifies where interest becomes an inquiry. Comparing conversion rates across devices exposes experience gaps hidden by averages, while identifying website growth patterns separates durable progress from a temporary spike.
Website performance reporting starts with a reporting contract
Record the period, time zone, data source, conversion definition, excluded traffic, and comparison. Website performance reporting loses credibility when one month counts submissions and the next counts clicks, or internal visits remain mixed with customers.
Strikingly's guide to built-in analytics explains that its statistics are not real-time and may differ from Google Analytics because of view definitions, geographic databases, time zones, and sampling. Choose one source for each repeated comparison and document it.
A decision-ready reporting agenda
- Confirm the business question and stable metric definitions.
- Use tracking traffic quality over time to show whether attention became more relevant.
- Use measuring leads generated by pages to show which content contributed useful inquiries.
- Use comparing conversion rates across devices before judging the whole site.
- Use identifying website growth patterns to name one credible change and next action.
Keep the agenda consistent, but let the business question determine the detail. The Strikingly article on website performance analysis distinguishes a report that says what happened from analysis that explains what should change.
Website performance reporting should name each finding's user. Marketing may own source quality, a page owner the message, and sales lead validation. Without that handoff, nobody receives a decision to make.
Tracking traffic quality over time requires useful behavior

Strikingly Visitors Analytics
Tracking traffic quality over time starts with source and intent. Search visitors reaching an educational guide should not be judged against returning email subscribers opening a limited offer. Group traffic by channel, campaign, landing page, and visitor task, then choose behavior that represents progress for each group.
Use a signal chain: arrival, meaningful interaction, relevant next page, and business action. Tracking traffic quality over time is clearer when a search visitor reads a guide and opens a service page than when a report records only session length, which can also reflect confusion.
Set a minimum sample before calling a channel strong or weak. Tracking traffic quality over time across ten visits can produce dramatic percentages that disappear with the next visitor. Show counts beside rates, flag small segments, and wait for enough comparable activity before reallocating budget.
Compare equivalent periods and annotate campaigns, publishing, tracking changes, outages, promotions, and seasonality. Tracking traffic quality over time needs context because an untargeted mention may lower engagement without making the site worse. The Strikingly guide to website traffic analysis connects sources, behavior, goals, and conversion.
Give each priority source one volume and one quality metric. Organic search might use visits and service-page continuation; email might use sessions and offer completion. Website performance reporting should show both so high-intent channels are not dismissed beside larger, weaker ones.
For tracking traffic quality over time, keep campaign naming stable and separate internal, referral-spam, and test activity where the tools allow it. A clean trend is more useful than a larger total contaminated by traffic that never represented a prospective customer.
Measuring leads generated by pages creates accountability

Strikingly Contact Form Response Analytics
Measuring leads generated by pages requires a conversion map: entry page, primary action, destination, completion event, and qualification result. Because a lead may begin with an article and finish on a contact page, distinguish assisting pages from final submission pages.
Define leads by purpose because signups, quotes, registrations, downloads, bookings, and product inquiries express different intent. Measuring leads generated by pages is misleading when all become one total. Show each type's count, rate, and qualified share.
Choose a consistent attribution rule and disclose it. Measuring leads generated by pages can use the final page, first landing page, or an assisted-page model, but the report should not switch among them to make performance look stronger. Where volume permits, show final and assisted contribution separately.
Use Strikingly Custom Forms to collect details needed to evaluate fit, then review source categories through Managing Your Users. Measuring leads generated by pages improves when sales can connect each request with the page promise and lead outcome.
For deeper paths, connect Google Analytics 4 with Strikingly. The official event-tracking guide notes automatic events for form submissions and button clicks. Measuring leads generated by pages should still use verified completion events rather than assuming every CTA click became a lead.
Report absolute leads beside conversion rate. A page can improve its rate because low-quality traffic disappeared while producing fewer qualified inquiries overall. Website performance reporting should state whether the change came from traffic volume, audience fit, page effectiveness, or lead definition.
Pair measuring leads generated by pages with response outcomes: accepted, disqualified, unanswered, booked, or sold. That feedback prevents a high-submission page from being praised when its promise attracts the wrong request, and it gives writers better evidence for revising the offer.
Comparing conversion rates across devices must be fair
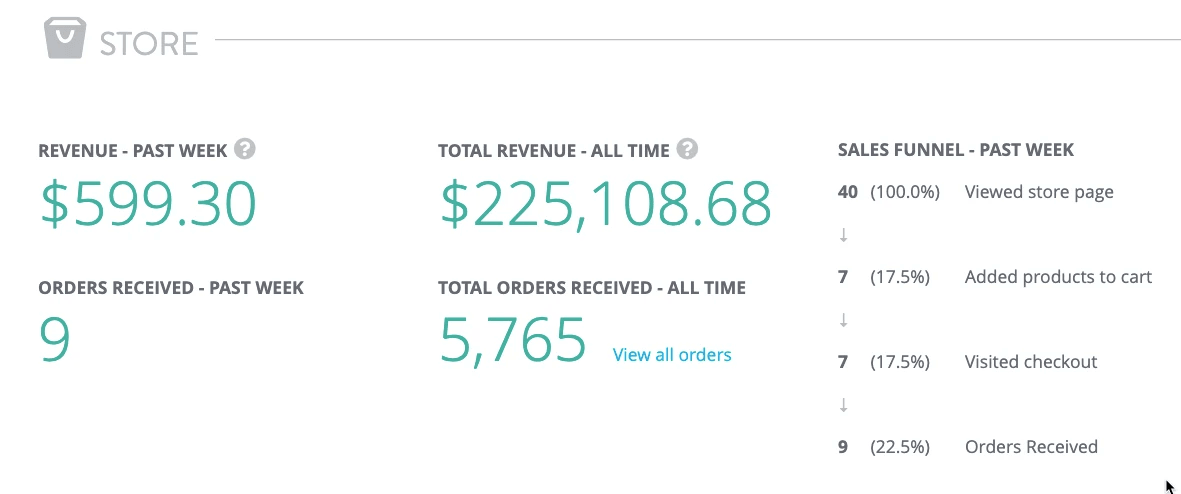
Strikingly Store Analytics
Comparing conversion rates across devices begins with the same outcome and period. Use completed inquiries divided by eligible visits for both desktop and mobile, then separate tablets if volume is sufficient. Do not compare desktop purchases with mobile add-to-cart actions and call the result a device conversion gap.
Check traffic mix before blaming layout. Mobile visitors may arrive from broad social campaigns while desktop visitors arrive from branded search. Comparing conversion rates across devices should therefore include source, landing page, and new-versus-returning status. If the gap remains inside comparable segments, inspect the experience.
Show the denominator and confidence behind every gap. Comparing conversion rates across devices with 2 conversions from 20 mobile visits and 40 from 400 desktop visits produces the same rate, but not the same certainty. Small samples should trigger observation, not an expensive redesign.
Test live paths for slow media, hidden proof, cramped menus, keyboard obstruction, misplaced errors, tiny controls, and long forms. Comparing conversion rates across devices becomes actionable when the report names the divergence. The Strikingly article on responsive website design covers mobile optimization, flexible layouts, and cross-device testing.
A lower mobile rate is not automatically failure; visitors may research by phone and convert later elsewhere. Comparing conversion rates across devices should include assisted behavior where available and acknowledge attribution limits. Locate likely barriers without manufacturing certainty from incomplete identity data.
Identifying website growth patterns takes repeated evidence

Macro Template from Strikingly
Identifying website growth patterns requires repeated movement across related signals. One strong week is an observation. Several comparable periods showing better source quality, stronger page continuation, more qualified leads, and stable device performance form a more credible pattern.
Use rolling four-week and quarterly views. Identifying website growth patterns becomes easier when reports mark releases, campaigns, content updates, and measurement changes. The Strikingly article on leveraging data analytics recommends goals, meaningful indicators, audience segments, and continuous review.
Require at least two supporting signals before identifying website growth patterns. Rising qualified organic visits are more persuasive when relevant page continuations and accepted inquiries also rise. Website performance reporting should label the pattern as confirmed, emerging, or uncertain so readers understand how confidently to act.
Look for combinations rather than isolated wins. Tracking traffic quality over time may show that organic visits are becoming more relevant. Measuring leads generated by pages may show that two guides assist service inquiries. Comparing conversion rates across devices may show that a mobile form fix closed a persistent gap. Identifying website growth patterns connects those findings into a defensible explanation.
Pattern statement: During [period], [audience] changed by [amount] on [page or path]. The change appeared in [supporting signals], persisted across [comparison periods], and may reflect [documented cause]. We will test [one action] and review [primary and guardrail metrics] on [date].
Avoid turning correlation into a victory story. Identifying website growth patterns should include alternative explanations and confidence limits. The Strikingly article on business website analytics recommends connecting sources, behavior, outcomes, and a reversible test.
Continue identifying website growth patterns after a successful test. A result surviving another period and traffic mix is more dependable than a promotional spike. Record what would disprove the explanation as clearly as its supporting evidence.
Website performance reporting must end with ownership

Scribble Template from Strikingly
Close website performance reporting with three lines: what the team learned, what will change, and when the result will be reviewed. Assign one owner. Include a primary metric that should improve and a guardrail metric that must not deteriorate, such as lead volume alongside lead quality.
The Strikingly article on digital marketing website performance connects campaigns, engagement, conversion, and monthly review. Apply that discipline by tracking traffic quality over time with stable segments, measuring leads generated by pages with clear definitions, and comparing conversion rates across devices before making site-wide changes.
Keep identifying website growth patterns grounded in enough history to support action. Website performance reporting succeeds when the next meeting can revisit the same hypothesis and decide whether to keep, revise, or stop the change. A shorter report with that decision trail is more valuable than a polished dashboard nobody uses.
